

In May 2025, 1,584 videos from five Belarusian state-owned YouTube channels were analysed.
Daily channel activity

The STVBY YouTube channel (red line) shows the highest activity with sharp peaks of up to 25 videos per day.
Peak activity: 9 May is associated with Victory Day.
Volatility: All channels show uneven activity with sharp declines and increases.
NEWS.BY (yellow) and ONT TV Channel (green) are the second most active
Coordination: Some peaks in activity coincide between channels, which may indicate coordinated information campaigns.
Frequency of disinformation narratives

Let’s highlight the top 5 disinformation narratives in May 2025:
- Manipulation – 1,372 cases;
- Polarisation – 495 cases;
- Emotional exploitation – 331 cases;
- Conspiracy – 119 cases;
- Discrediting – 58 cases;
Manipulation accounts for 60% of all identified narratives.
There is a huge gap between first and second place (1,372 vs 495).
Emotional impact accounts for a significant share.
Distribution of risk levels by channel
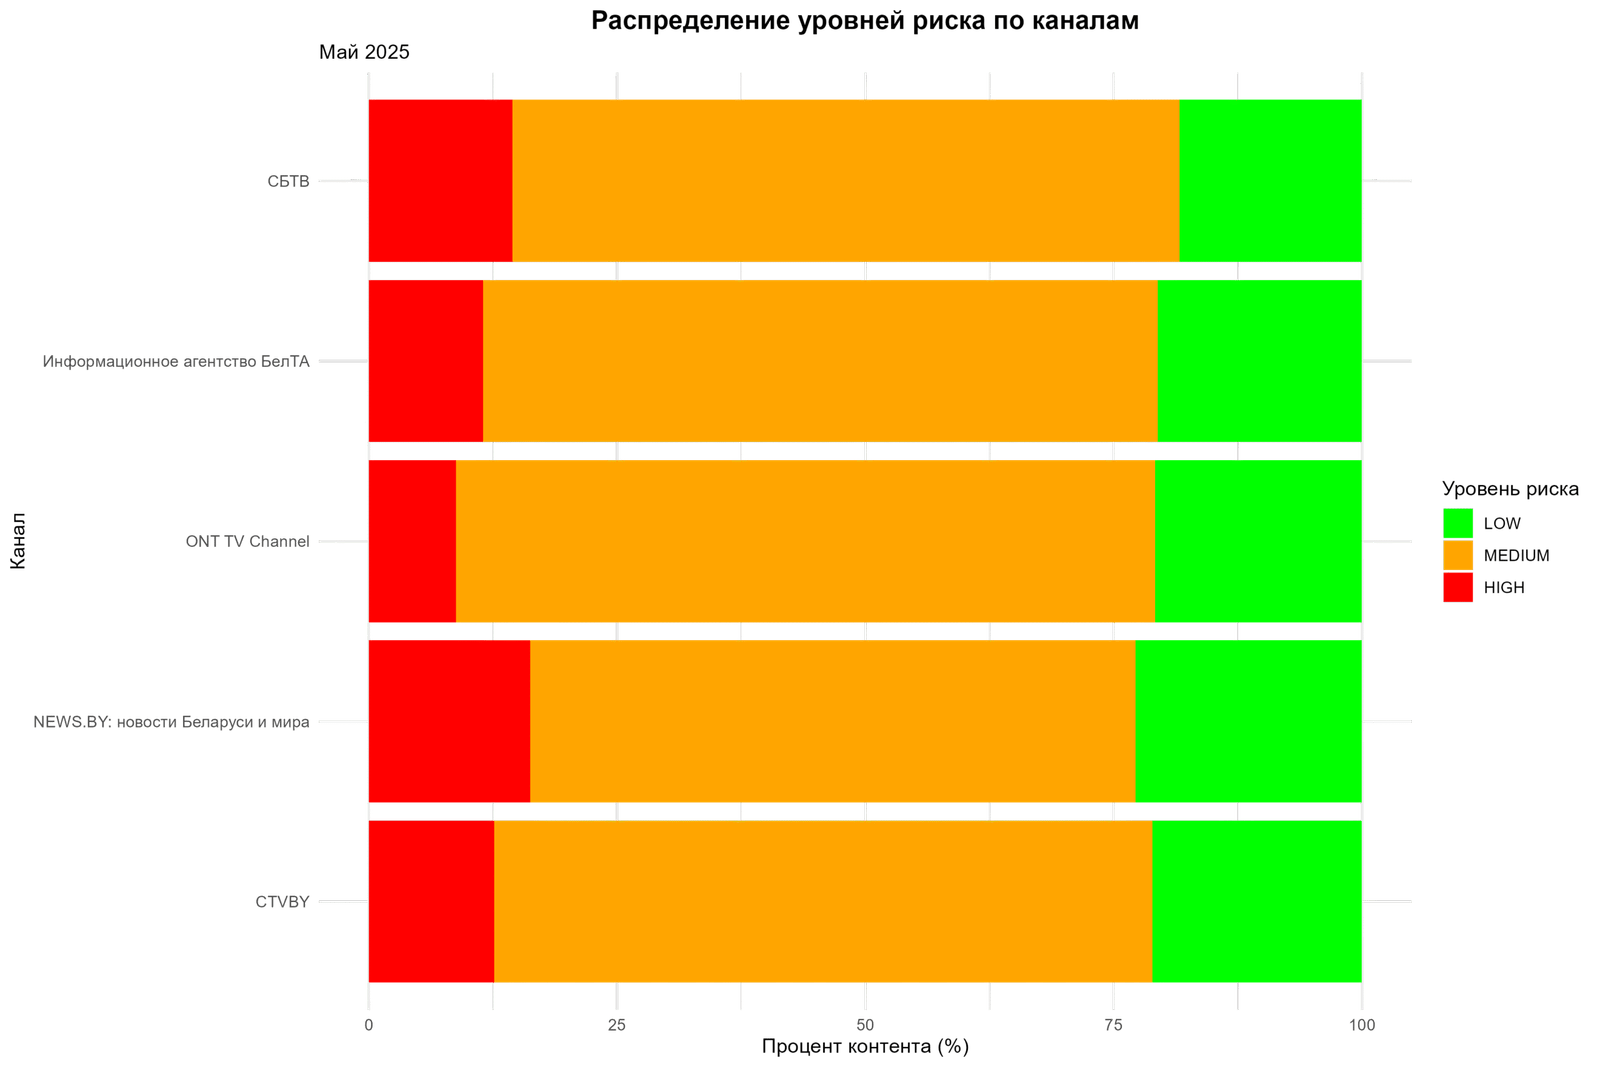
Analysis by channel:
- NEWS.BY: Highest percentage of high-risk content (~15-20%)
- CТВBY: Average risk level with a predominance of medium-risk content
- ONT TV Channel, BelTA, CBTV: Similar patterns with a moderate prevalence of medium- and low-risk content
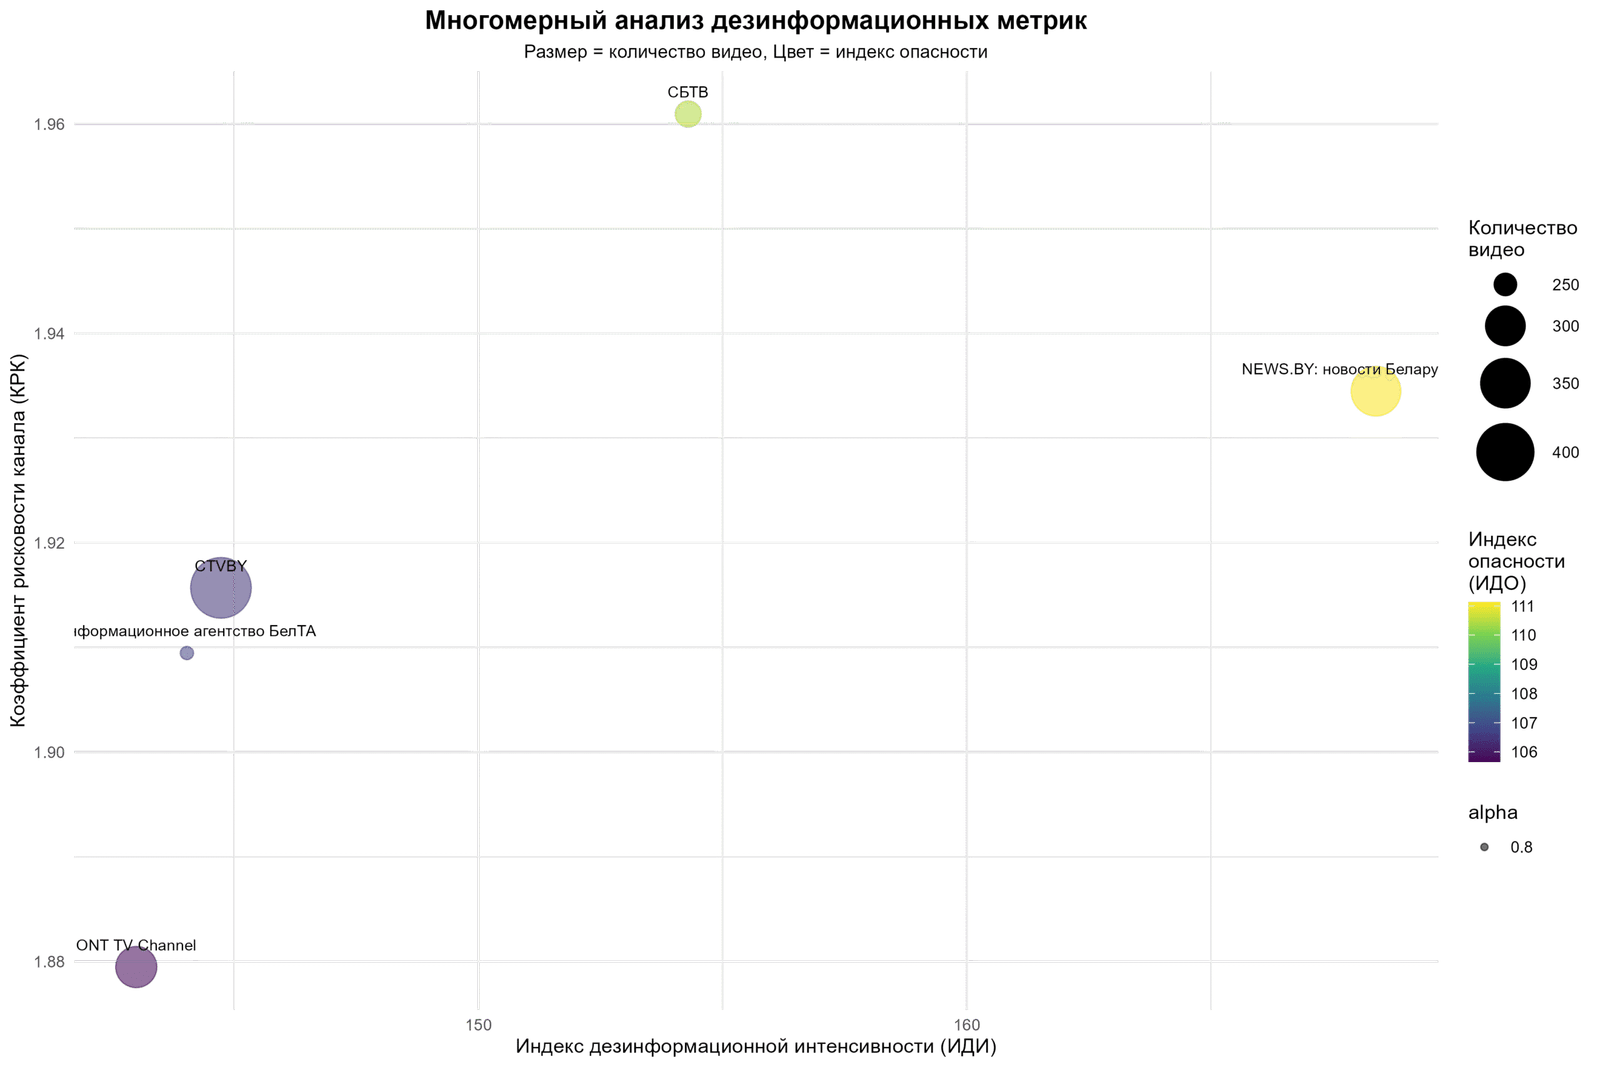
Methodology for calculating the Disinformation Risk Index (IDI)
Result: percentage value of the overall disinformation risk of the channel
Formula components
CRC – Channel risk coefficient (weight: 30%)
Range: 0-3 (the higher, the more dangerous)
Description: Directly measures the level of risk of content based on expert assessment
Range: 0-∞% (usually 0-200%)
Description: Shows the saturation of content with disinformation narratives
KM – Manipulation coefficient (weight: 20%)
Range: 0-100%
Description: The share of manipulative techniques among all identified narratives
IDI – Disinformation Engagement Index (weight: 25%)
Range: 0-∞% (usually 0-50%)
Description: The effectiveness of risky content on the audience
| CRC = 2.17 High risk |
IDI = 150% Intense narratives |
CM = 53.3% Many manipulations |
IVD = 15.2% Active audience |
CRI = 2.17, IDI = 1.50, CM = 0.533, IVD = 0.152
Step 2: Application of weights
IDD = (2.17 × 0.30 + 1.50 × 0.25 + 0.533 × 0.20 + 0.152 × 0.25) × 100
Step 3: Calculation
IDO = (0.651 + 0.375 + 0.107 + 0.038) × 100
Result: IDO = 117.1
IDO interpretation scale
| IDO range | Danger level | Description | Status |
|---|---|---|---|
| 0-25 | Low | Minimal disinformation activity | SAFE |
| 25-50 | Moderate | Occasional problems, requires monitoring | CAUTION |
| 50-75 | High | Systematic misinformation | DANGEROUS |
| 75-100 | Critical | Intense disinformation machine | ALERT |
| 100+ | Extreme | Professional disinformation centre | CRITICAL |
Justification of weight coefficients
| Component | Weight | Justification |
|---|---|---|
| CRC | 30% | The most important indicator is a direct expert assessment of the content’s danger. |
| IDI | 25% | Intensity = number of attempts to influence the audience |
| IVD | 25% | Effectiveness of impact and actual audience reach |
| KM | 20% | Specialisation in specific manipulative techniques |
Conclusions
87% of content contains manipulative narratives (1,372 out of ~1,584 videos). Systematic nature of disinformation across all state channels.
Influence tactics:
- Manipulation as the main tool of influence
- Polarisation of society through contrasting narratives
- Emotional exploitation to bypass critical thinking
- Conspiracy theories to create an alternative reality
Coordination patterns:
- Synchronised peaks of activity between channels
- Uniformity of narrative strategies
- Targeted information campaigns on key dates
An interactive table of disinformation narratives can be found here.
Data analysis and visualisation were performed using the R programming language.