
The publication continues monitoring Belarusian YouTube channels owned by state media. An additional context is the “slowing down” of YouTube in the Russian Federation that began in August 2024 and the Belarusian government’s plans to create a Belarusian OTT service – videobel.by.
Methodology
Data was collected using the YouTube API. Processing and visualization were performed using Python libraries – plotly, Dash, and sklearn.
The August 2024 results have been compiled into a table for comparison with data from July 2024:

Five “golden buttons” showed significant growth in both subscriber numbers and views. The number of posts was almost the same: 1425 in August 2024 and 1431 in July 2024.
In August 2024, nearly two thousand posts (1906) were published on nine Belarusian state-owned YouTube channels, which garnered 167 million views by September 1, 2024, a 67% increase compared to July 2024.
The daily distribution of post publications and the number of views for these publications:
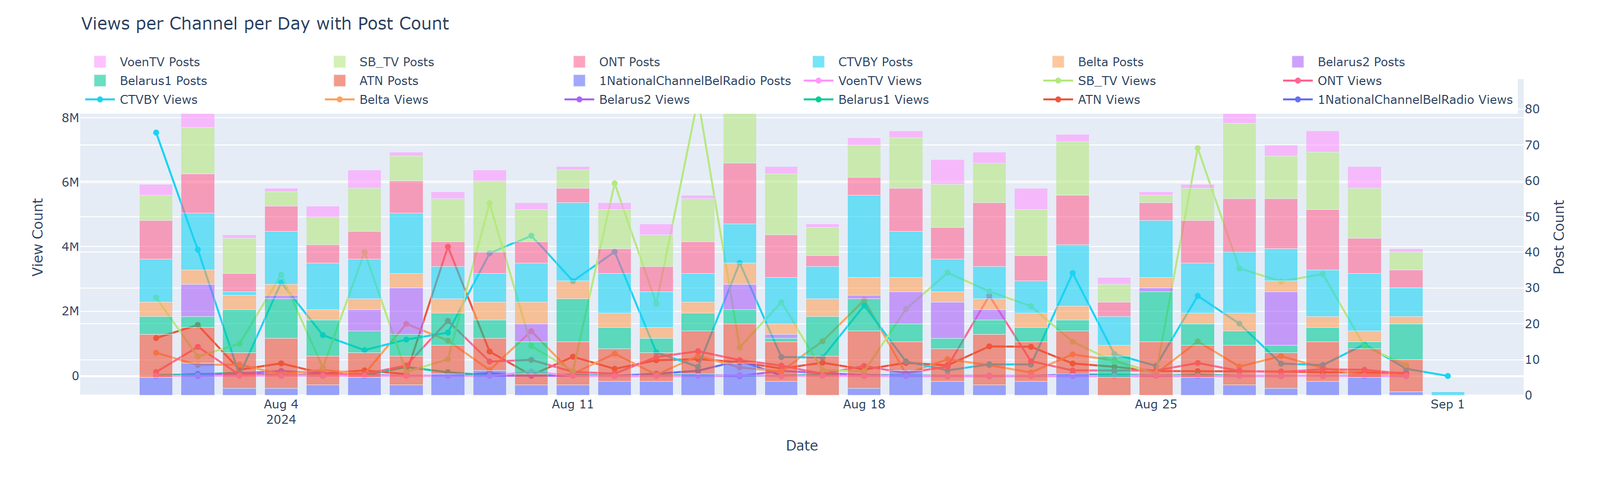
It is noteworthy that videos were uploaded every day of the week, despite August being a vacation month, with only slight decreases on a few Saturdays.
Visualization of basic characteristics:

The SB_TV channel somehow collected 2.4 million likes!
Content
Top 30 videos that garnered the most views:

The current Belarusian authorities emphasize that Belarus is not involved in military actions, but almost all videos in the top 30 by views promote the Russian war agenda against Ukraine.
Now let’s exclude shorts videos (less than 60 seconds) and see how the list of the most viewed videos changes:
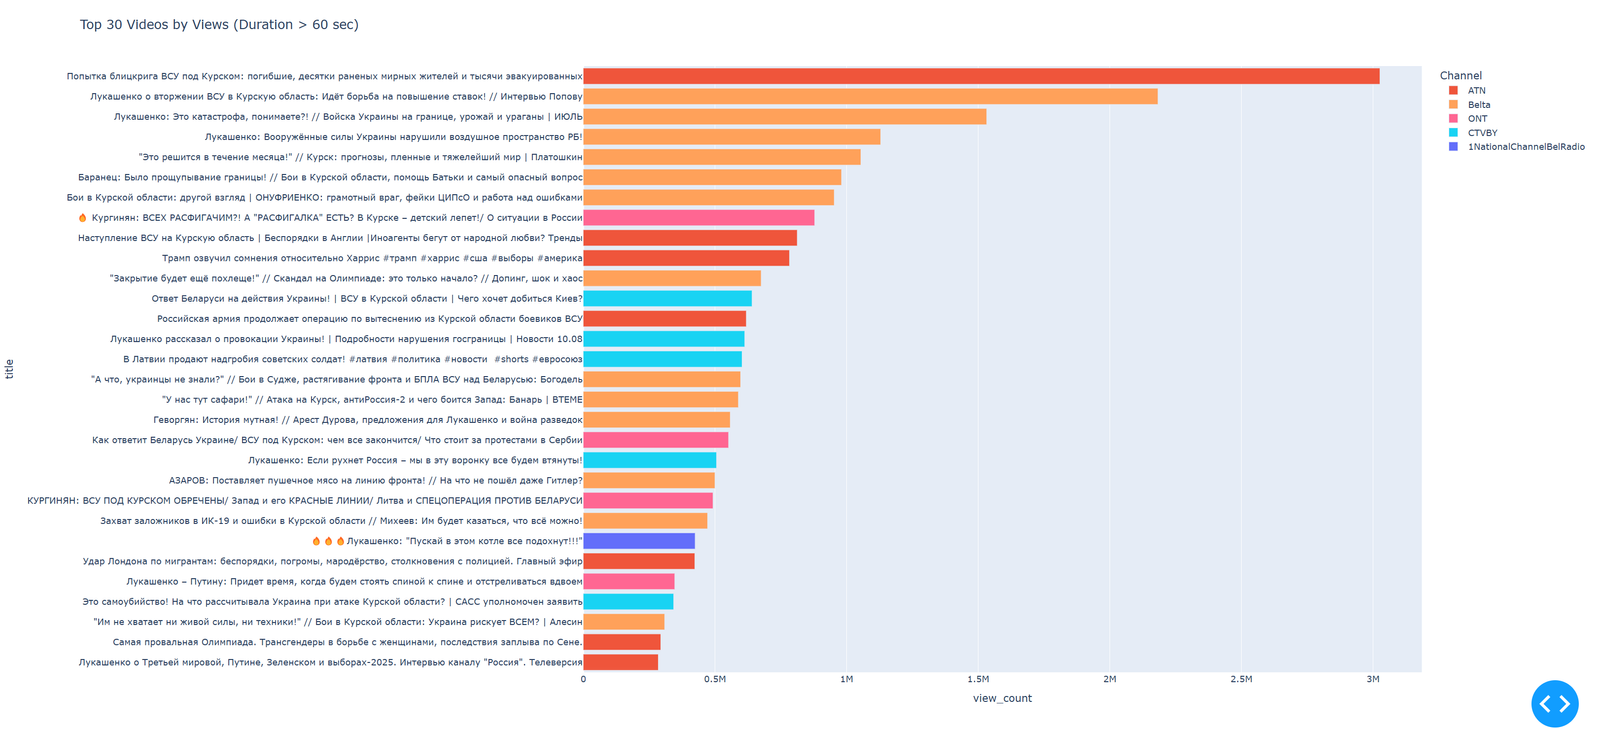
Here, the range of disinformation narratives expands. Of course, most concern fake stories about the military operations of the Ukrainian Armed Forces in the Kursk region, aiming to convey that Russia can change the situation on its territory. There are a couple of stories about the “failure” of the Olympic Games in Paris. And an intriguing report on the U.S. elections, suggesting that American policy toward the Belarusian authorities could change if Donald Trump wins. Naturally, Latvia is also targeted with a clickbait headline about the sale of Soviet soldiers’ tombstones.
Engagement
A K-means cluster analysis was conducted. This is a machine learning method used to divide a dataset into groups (clusters) with similar characteristics. K-means works by iteratively assigning data to clusters based on proximity to centroids, which are the average values within each cluster.

Cluster definition: The graph likely shows the distribution of objects (e.g., posts) by the number of views and likes, divided into several clusters. Each cluster represents a group of posts with similar characteristics in terms of views and likes.
Cluster interpretation: For example, one cluster may represent posts with a large number of views but relatively few likes, another — with few views and likes, and so on. Each cluster helps better understand the data structure and identify characteristic groups.
A dynamic K-means graph based on data from 1906 posts published in August 2024 and a 3D model graph, with views, likes, and comments plotted on the axes.
For an in-depth analysis of engagement with videos published on state-owned YouTube channels, a Quadrant Chart was created.

Each dot on the chart corresponds to a separate video on the YouTube channel. This chart allows for the visualization and analysis of video popularity and engagement.
Axes of the chart:
- X-axis (Average Watch Time): This axis shows the average time viewers spend watching each video (in seconds). The further to the right the dot is, the longer viewers watch the video. High values indicate that the video successfully retains viewers’ attention.
- Y-axis (Engagement Rate): This axis shows the ratio of likes to views (engagement). Higher values on the Y-axis mean that the video generates active reactions from viewers (many likes relative to views).
Size and color of the dots:
- Dot size (Comments): The size of the dot on the chart corresponds to the number of comments under the video. Larger dots indicate videos that are actively discussed by viewers, which may indicate significant interest in the topic.
- Dot color (Number of views): The color of the dots ranges from cool (less saturated colors) to warm (more saturated colors) depending on the number of views. More saturated colors indicate videos with a higher number of views.
Interpretation:
- Upper right quadrant: Videos in this quadrant have high average watch time and high engagement rates. This means that these videos not only hold viewers’ attention but also provoke active reactions. These are the most successful videos in terms of audience retention and engagement.
- Upper left quadrant: Videos in this quadrant have low average watch time but high engagement rates. This may indicate that the videos are short but interesting or controversial enough that viewers actively discuss them and like them.
- Lower right quadrant: Videos in this quadrant have high average watch time but low engagement. These videos may be informative or lengthy but do not encourage viewers to take active actions like liking or commenting.
- Lower left quadrant: Videos in this quadrant have both low average watch time and low engagement rates. Such videos may be less interesting to the audience and require improvement.
This interactive chart provides a visual representation of which videos on the channel are the most successful in terms of audience retention and engagement.
“Slowing Down” of YouTube in Russia
YouTube traffic in Russia dropped by more than 30% after the slowdown. This was noted by the head of the “Internet Protection Society,” Mikhail Klimarev, as well as “Novaya Gazeta.”
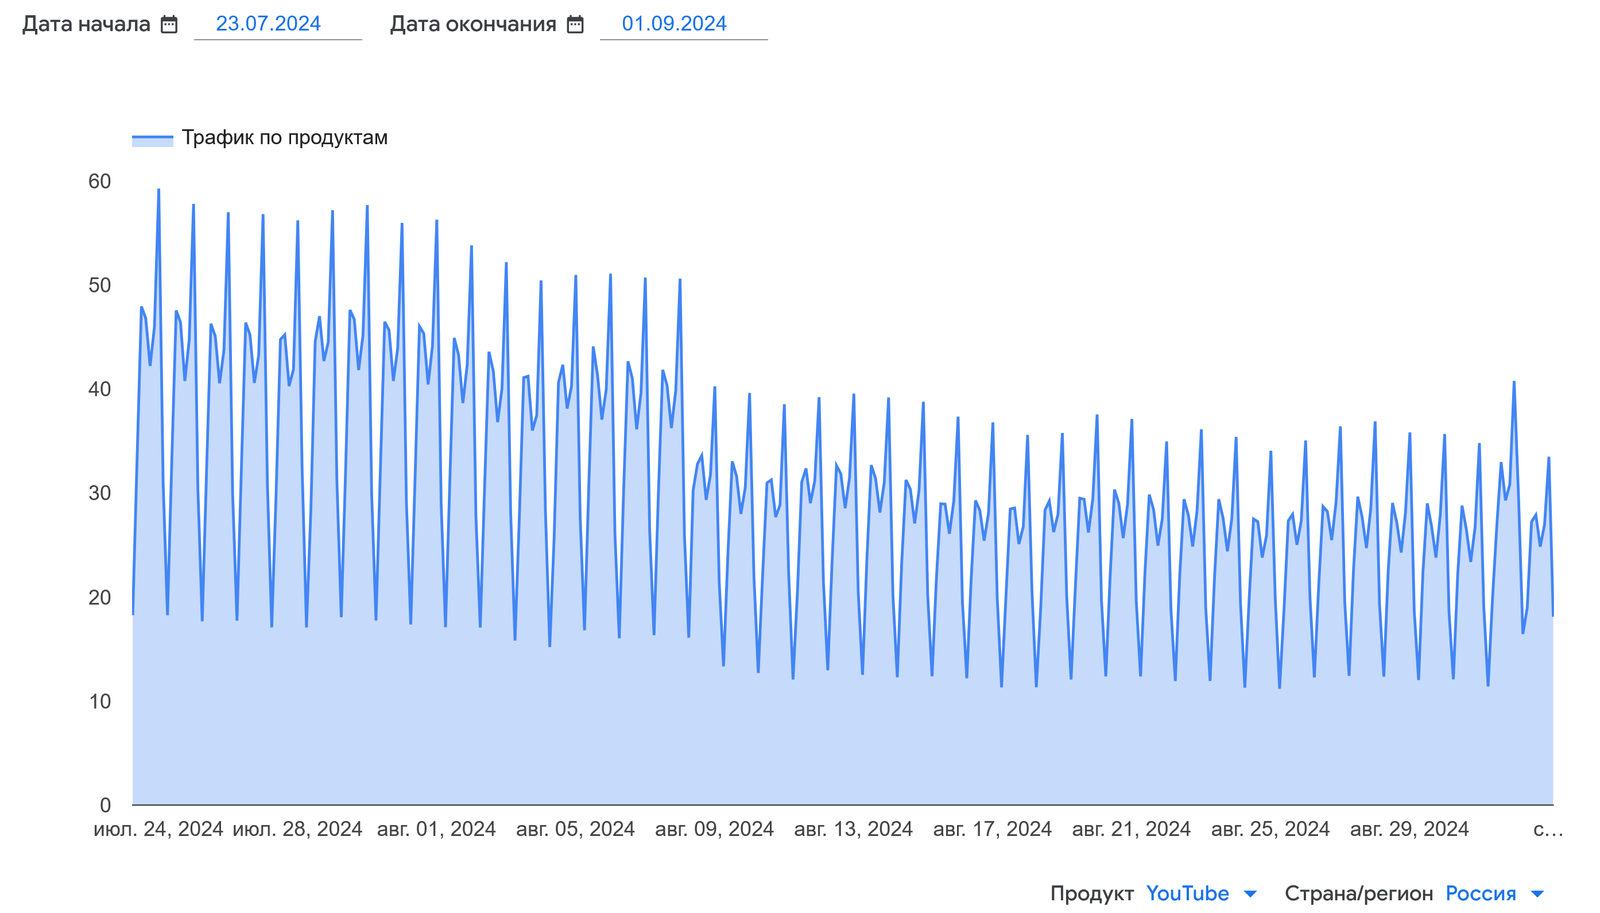
They analyzed the traffic drop based on Google data. According to “Novaya Gazeta,” YouTube traffic in August compared to July fell by 35%. According to Klimarev’s calculations, it fell by 38%.
Also, Russian experts in their publications and interviews reported that the number of views of news content on YouTube increased in August 2024.
The main conclusion that can be drawn from the results of August 2024 is that Belarusian state-owned YouTube channels continued to be actively involved in the hybrid war on the side of the Russian Federation against Ukraine. It can also be assumed that this content was still consumed by the Russian internet audience. Since Russian TV channels try not to cover events in the Kursk region, Belarusian state-owned media YouTube channels, through content of varying lengths, informed Russian citizens according to the narratives of Russian propaganda.