

Digital Archaeology: How YouTube Traffic Reveals the True Picture of Belarus’s Information Environment Transformation.
This research was conducted using open data from the Google Transparency Report API. The complete methodology and analysis code are available for verification by the scientific community.
Why should fact-checkers study YouTube traffic?
In the era of information wars and the fight against disinformation, objective metrics that can show the real state of the information environment acquire special significance. Traditional sociological surveys under authoritarian conditions often provide a distorted picture, as respondents fear openly expressing their views.
YouTube traffic, obtained through the official Google Transparency Report API, represents a unique source of “honest data” – people cannot lie about what content they actually consume. For fact-checkers, this means the opportunity to get an objective picture of how political events influence citizens’ information behavior.
Methodology and data sources
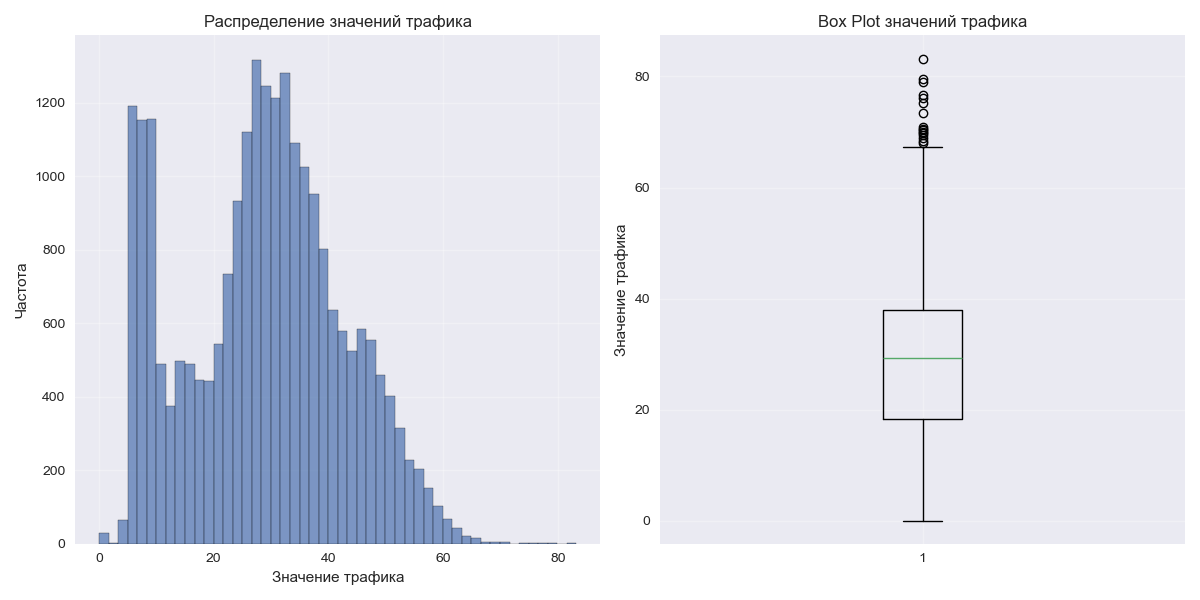
This research is based on the analysis of 23,500 data points about YouTube traffic in Belarus for the period from January 2020 to July 2025. The data was collected through the official Google Transparency Report API, which provides information about the share of YouTube traffic relative to the baseline level.
Key metrics:
Observation period: 2,011 days (2020-01-01 – 2025-07-06)
Value range: from 0.048 to 83.22
Average value: 28.71
Median: 29.39
51 statistical anomalies identified
Important research limitations:
The data does not include VPN traffic, which could have grown substantially after 2020. The API provides relative, not absolute values. Technical changes in measurement may affect the comparability of data from different periods.
Chronicle of information upheavals through the lens of YouTube
The graph demonstrates how major political events are instantly reflected in digital consumption patterns, creating a unique chronicle of information crises.
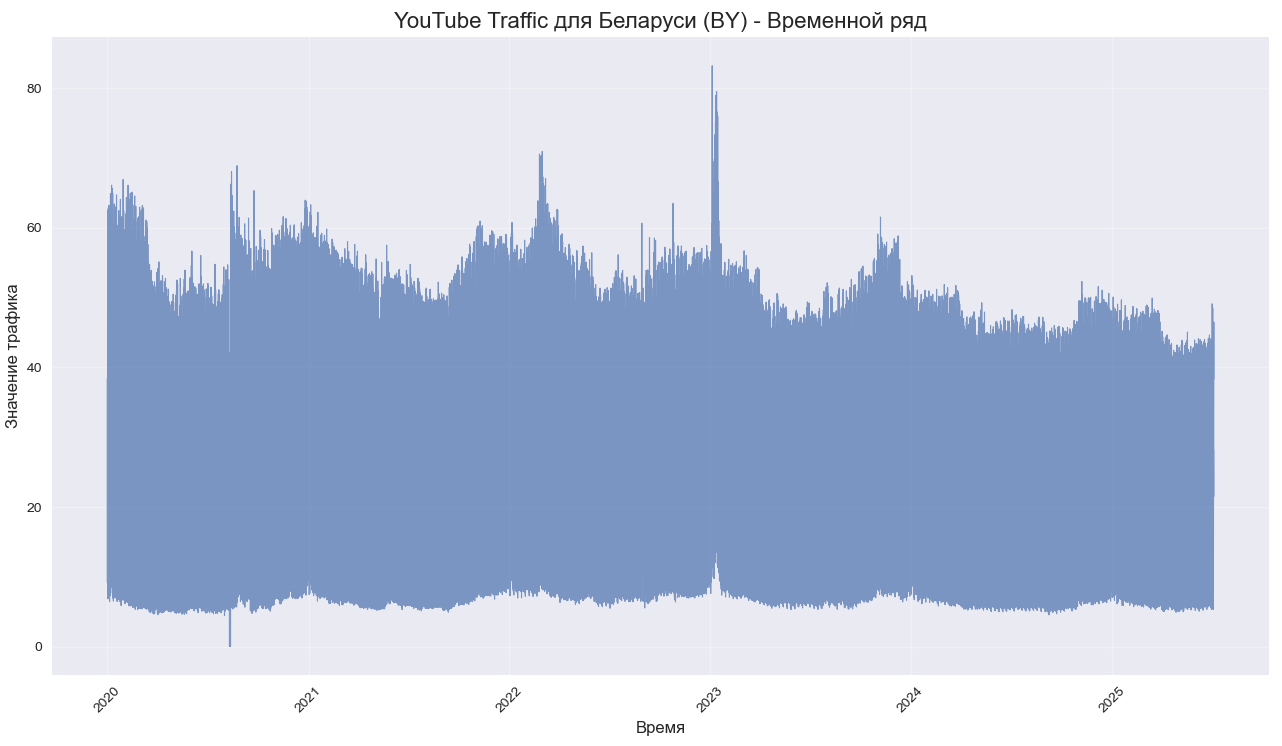
Pandemic as information catalyst (January-March 2020)
The historical maximum of 35.65 in January 2020 reflects a unique situation: the beginning of the pandemic led to increased consumption of informational content, while there was no lockdown in Belarus. This period shows the “natural” level of interest in YouTube as a source of information and entertainment under conditions of heightened anxiety.
Information blackout / Shutdown (August 2020)
The dramatic drop to 0.048 documents an attempt at complete control over the information space through technical blocking of IPv6. For fact-checkers, this is a critically important case: it shows how technical methods can instantly limit access to alternative sources of information.
Three-wave model of information emigration
The analysis reveals three distinct waves, each of which swept away a certain type of information consumer:
2021: Exodus of independent content creators
The first wave affected journalists, activists, creators of analytical content. Total repressions against civil society and the liquidation of NGOs led to the relocation of precisely those people who created and actively consumed quality informational content on YouTube.
Profile of information migrants 2021:
- Independent journalists – content creators
- Activists – active information distributors
- NGO employees – educated audience
- Intelligentsia – consumers of analytical content
Consequences for the information environment:
Reduction of local quality content. Loss of “opinion influencers” and public opinion leaders. Decreased demand for analytical materials. Weakening of connections with international information sources
2022: Corporate information emigration
Sanctions and corporate security requirements led to the organized evacuation of IT personnel. This audience was distinguished by a high level of media literacy, VPN usage, and consumption of international content.
2023+: Final transformation of the media landscape
The period is characterized by continuing “catch-up” repressions and simultaneous dominance of TikTok among the Belarusian audience inside the country. Quantitative indicators of information environment degradation.
Change in information habits
The graph shows how temporal patterns of information consumption have changed:
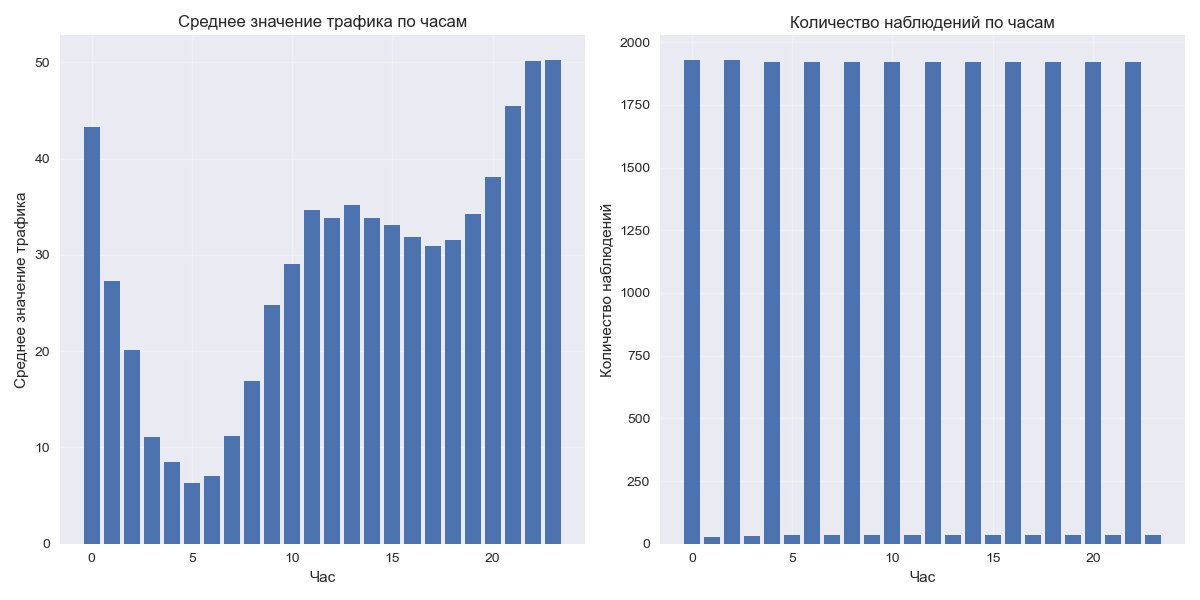
Concentration of activity in late evening hours (22:00-23:00 with values above 50) may indicate several important trends:
- Information caution: people prefer to consume content at home, in a safe environment
- Family viewing: collective consumption of content as a form of information security
- Avoiding work hours: reduced willingness to seek information during the workday
The graph demonstrates relative stability of weekly patterns, but with an enhanced role for weekends:
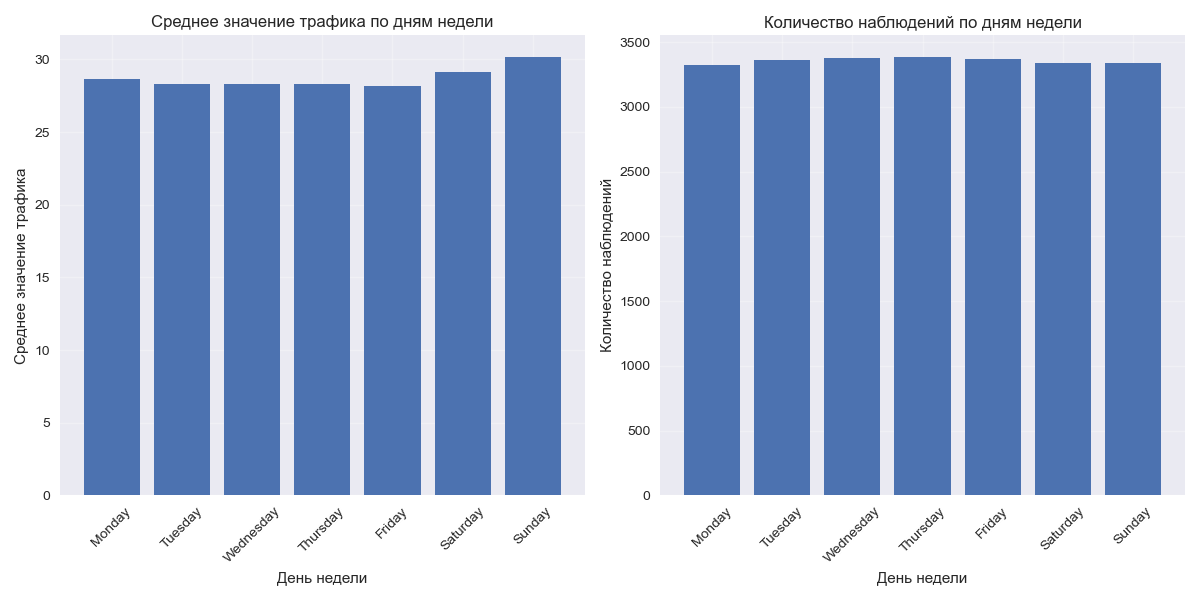
Sunday and Saturday become the main days for information consumption, which may reflect the psychological need for an “information break” on workdays.
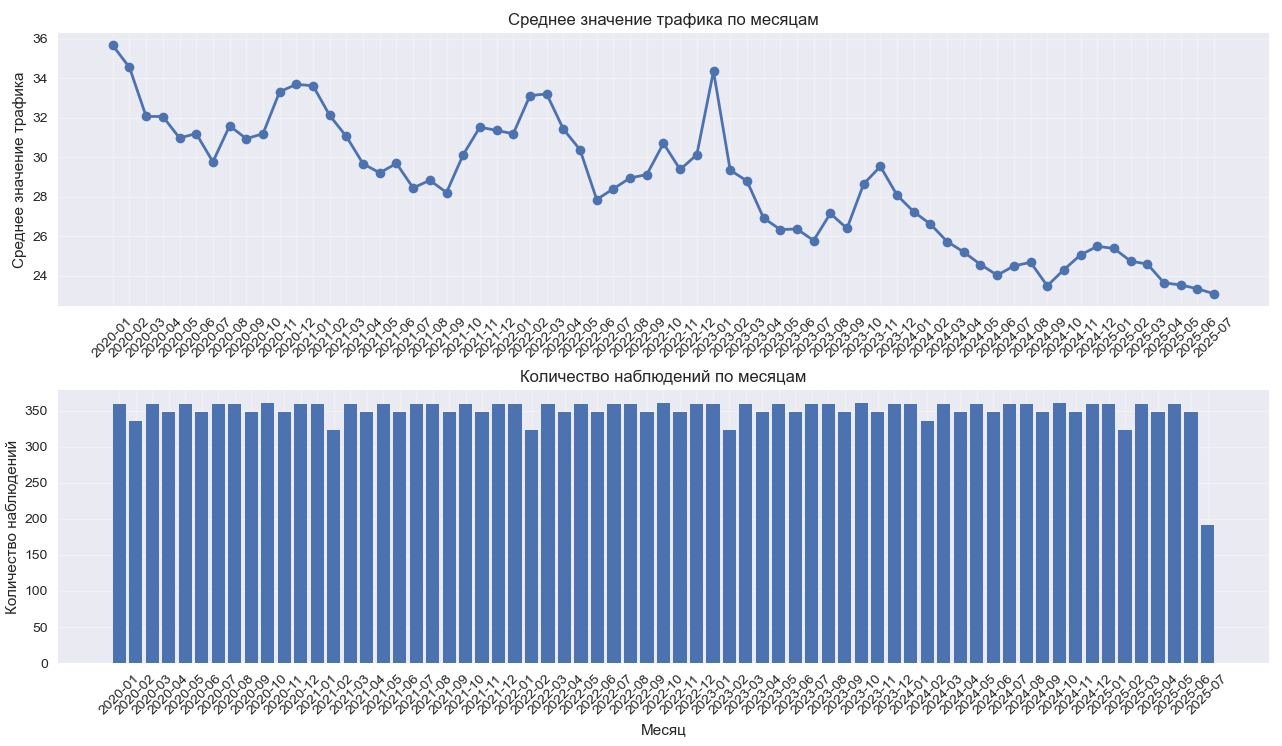
Seasonal cycles and the victory of entertainment content
The graph is key to understanding the transformation of information needs. The stable downward trend with winter peaks and summer troughs reflects not only climatic features, but also fundamental changes in the type of content consumed.
TikTok as an indicator of information degradation
The dominance of TikTok since autumn 2023 among the Belarusian internet audience in the country reflects important transformations:
Information preferences of the “new” audience:
- Less politicized content instead of news analysis
- Entertainment focus instead of educational
- Short formats instead of deep analysis
- Local trends instead of international agenda
Adaptation mechanisms:
- Escapism as protection from information stress
- Preference for light content over complex topics
- Conscious distraction from political reality
For fact-checkers, this means a cardinal change in audience: instead of people actively seeking and critically evaluating information, an audience has formed that consciously avoids complex content.
Statistical anomalies as information events
The graph reveals 51 statistical anomalies, with all top-5 concentrated in January 2023 with a peak of 83.22 (January 4, 22:00).
These outliers may reflect:
- Information hunger: compensatory consumption after periods of restrictions
- Last surges: final activity before TikTok dominance
- Technical artifacts: API peculiarities during transition periods
- Event reaction: reaction to specific information triggers
Information archaeology as an analysis tool
Systemic transformation of information culture
Analysis of YouTube data reveals deep structural changes in the information needs of Belarusian society. Demand for analytical content has practically disappeared from the information space, as people have stopped seeking deep analysis of events and prefer superficial information. Simultaneously, there has been a critical decline in media literacy, manifested in less critical media consumption and readiness to accept information without proper verification.
The international orientation of the audience has given way to a focus on local topics, reflecting a general narrowing of information horizons. Educational requests have yielded to the priority of entertainment over learning, which has fundamentally changed the structure of consumed content.
In the new information environment, fundamentally different consumption patterns dominate. Entertainment consumption has become the main way of interacting with content, where media serve primarily to distract from reality rather than to gain knowledge. Local interests have displaced the global agenda, leading to reduced understanding of international processes and contexts.
Particularly alarming is the transition to passive media behavior, when the audience focuses exclusively on content consumption instead of its creation and active distribution. This is accompanied by systematic avoidance of complex topics, which actually represents a form of information self-censorship.
YouTube as a tool for monitoring the information environment
For fact-checking and disinformation analysis specialists, YouTube traffic represents a unique opportunity for objective monitoring of the media landscape state. The data demonstrates a direct correlation between information environment health and YouTube traffic levels, allowing this indicator to be used as a measure of the overall state of the information ecosystem.
The success of information restrictions is directly reflected in sustained traffic decline, while the completion of information environment transformation is manifested in stabilization of indicators at a qualitatively new, lower level. This creates the possibility for quantitative assessment of state information policy effectiveness.
The chronology of events demonstrates clear correlation with repressive measures. The beginning of total repressions in 2021 led to sustained decline in analytical content consumption, as the main creators and consumers of quality information products left the country. Increased pressure and introduction of technical restrictions in 2022 accelerated the information environment degradation process, affecting broader layers of media-literate audience. The period from 2023 is characterized by “cleanup” of independent journalism remnants, leading to stabilization of a primitive media landscape.
Practical conclusions for fact-checkers
Audience transformation requires radical changes in strategy for working with information consumers. Content format should evolve toward shorter and more visual materials, as the audience’s ability to perceive complex textual content has significantly decreased. Platform strategy also needs revision, as reaching mass audience now requires mandatory presence on TikTok, which has become the dominant information source.
Temporal aspects of content publication have acquired new significance, as data shows concentration of activity in evening hours and weekends. This reflects psychological changes in information behavior, when people prefer to consume content in a safe home environment. Thematic strategy requires a delicate balance between important information and entertaining presentation, as straightforward educational approach no longer resonates with the audience.
YouTube traffic can serve as an early indicator of multiple important processes in the information environment. Changes in traffic indicators allow assessment of information restriction effectiveness before their influence becomes obvious through traditional monitoring channels. The data also reflects changes in media consumption, allowing fact-checkers to adapt their strategies to evolving audience needs.
Audience reaction to political events is also reflected in traffic fluctuations, creating opportunities for predicting information trends. The success of competing platforms can be tracked through YouTube indicator dynamics, helping understand migration processes in digital space and correspondingly adjust information strategy.
This research demonstrates that analysis of digital behavior can serve as a powerful tool for understanding the real state of the information environment, especially under conditions where traditional research methods (surveys, interviews) provide a distorted picture due to respondent fears.
Key discoveries for the fact-checking sphere:
- Technical restrictions provide immediate but temporary effect
- Repressions against content creators create long-term information environment degradation
- Economic sanctions accelerate the process through loss of media-literate audience
- Competition from entertainment platforms completes the transformation
“New normal” of Belarusian information space: Stabilization of YouTube traffic at 22-25 level (against historical 35+) reflects the formation of a fundamentally different type of information culture: depoliticized, entertainment-oriented, with limited critical demands.
This data confirms the necessity of adapting work strategy to a new audience that fundamentally differs from the one that existed before 2020. Understanding these changes is critically important for effective fight against disinformation under modern conditions.
YouTube traffic functions as a “barometer of information democracy”, providing fact-checkers with an objective tool for real-time monitoring of media landscape state. This approach can be applied to analyze the information environment in other countries of the region facing similar challenges.
Acknowledgment:
For preparation of this publication, python scripts from the project Google Transparency Report YouTube Traffic Downloader and Merger were used as a basis
This publication was developed by a research team under the leadership of Mikhail Doroshevich, PhD